Skip to content
Curiosity Diaries

Gallery of Wisdom

Ideas in a single glance

Visual explainers and story carousels from the diary.
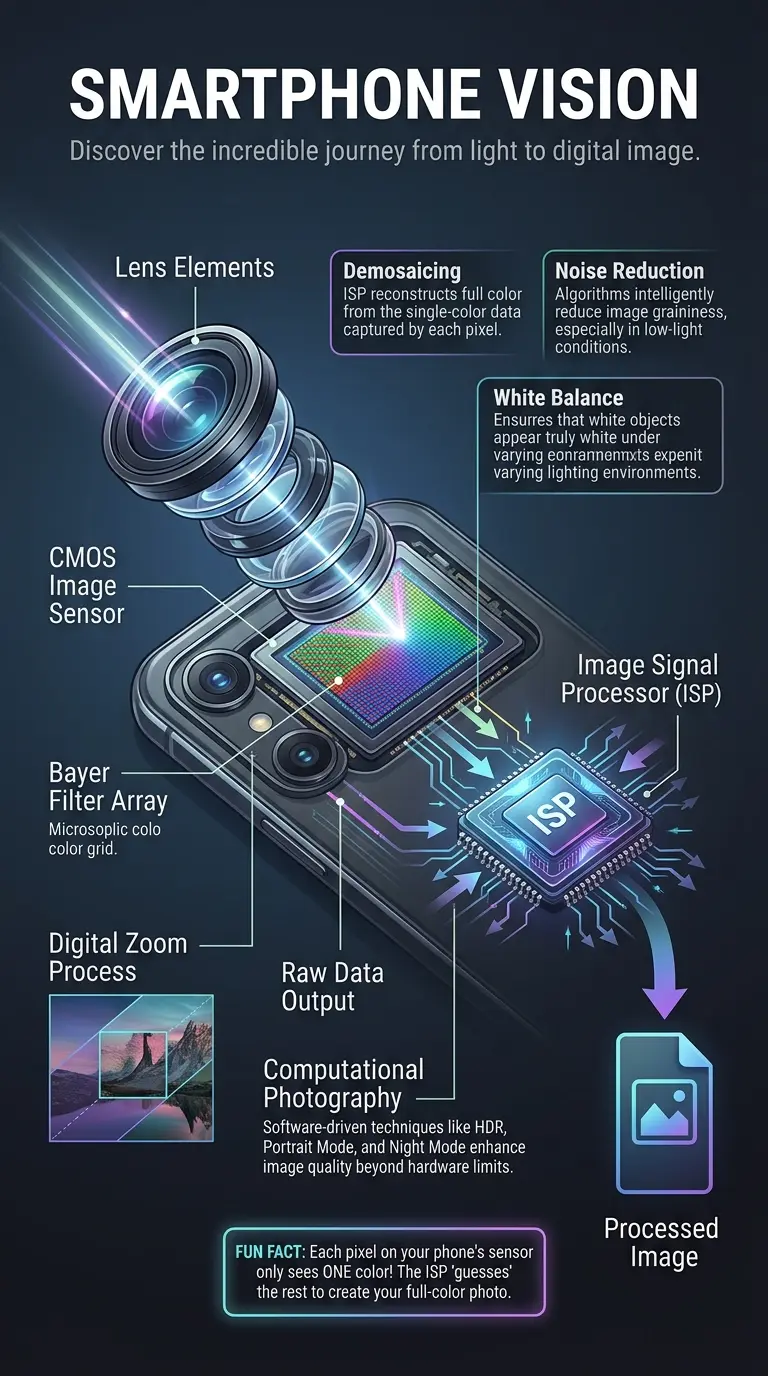
Educational infographic detailing the complex internal workings of a smartphone camera. It features a semi-realistic cutaway illustration of a camera module, highlighting components like lens elements, CMOS image sensor with Bayer filter, and the Image Signal Processor (ISP). The infographic explains concepts such as demosaicing, noise reduction, and computational photography (HDR, Night Mode, Portrait Mode) using labeled sections, directional arrows illustrating light and data flow, and explanation boxes. A fun fact is included. The design is clean, professional, and optimized for vertical viewing with a dark tech-magazine aesthetic.

Unlock Your Phone Camera's Hidden Magic! 📸

101
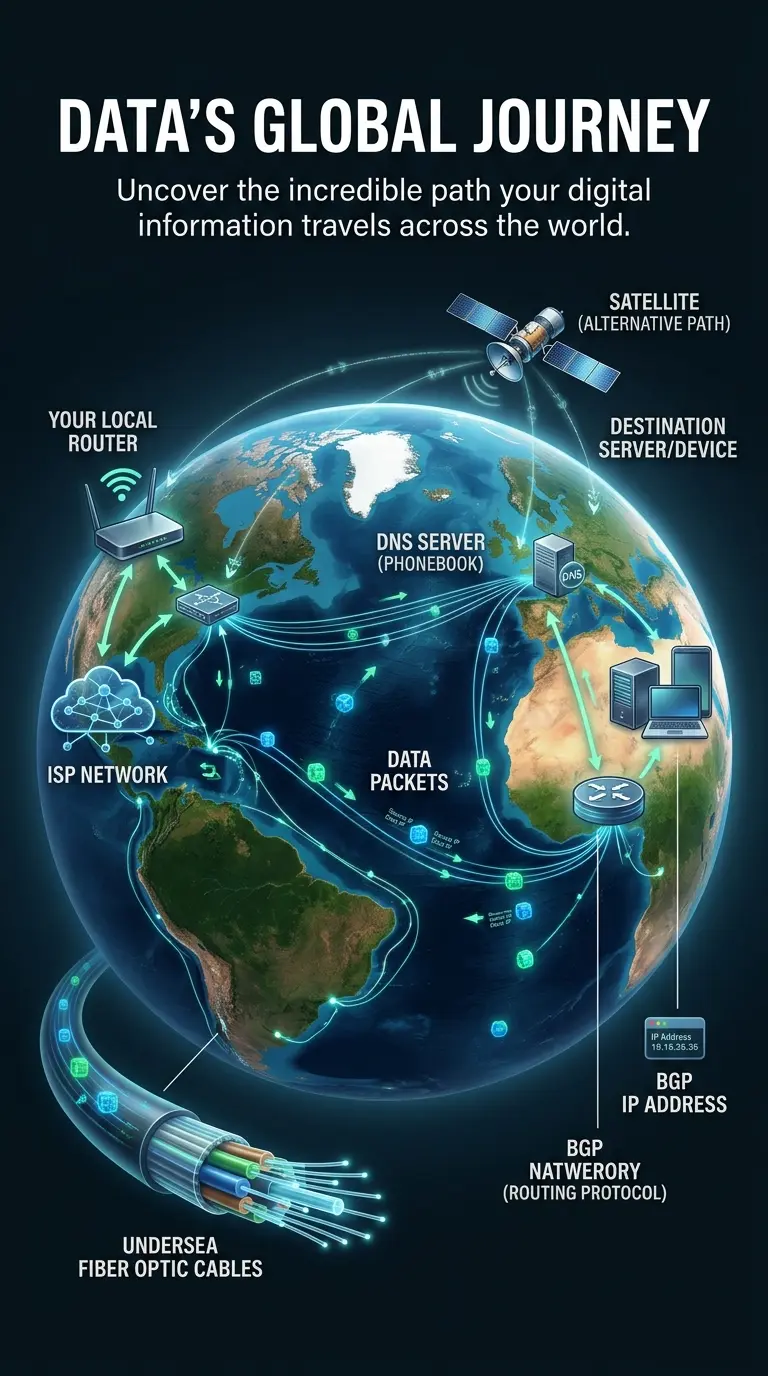
Infographic illustrating how digital data instantly crosses continents via a global network of undersea fiber optic cables, routers, satellites, and data packets. Features a cutaway Earth with glowing data pathways and key components labeled.

How Your Data Crosses Oceans in a Flash ⚡️

104
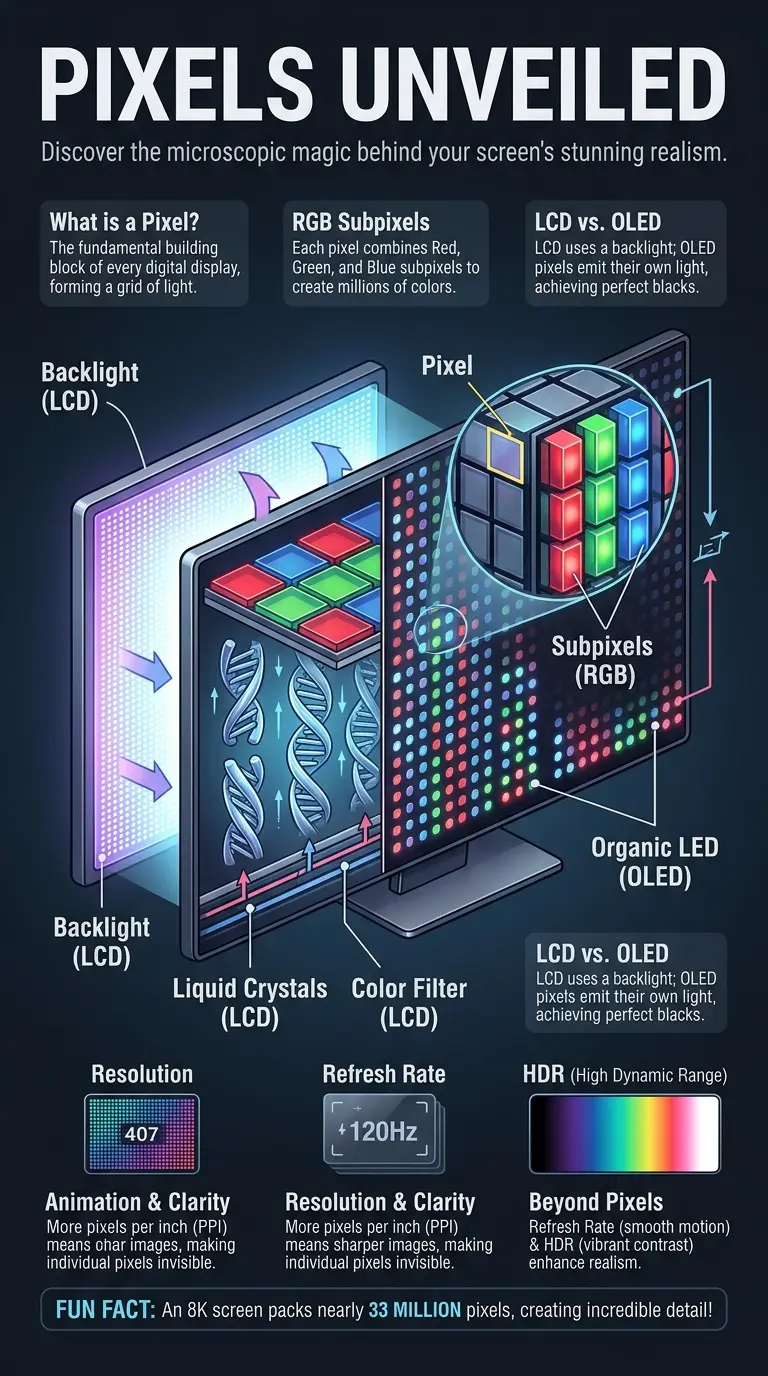
Infographic explaining the science behind screen realism, detailing pixels, subpixels (RGB), LCD and OLED technologies, refresh rate, and HDR, with a focus on how digital displays create immersive visuals. Features a cutaway view of a screen with labeled components and educational facts.

Unlock the Secret Life of Pixels: Why Your Screen Looks So Real! ✨

92
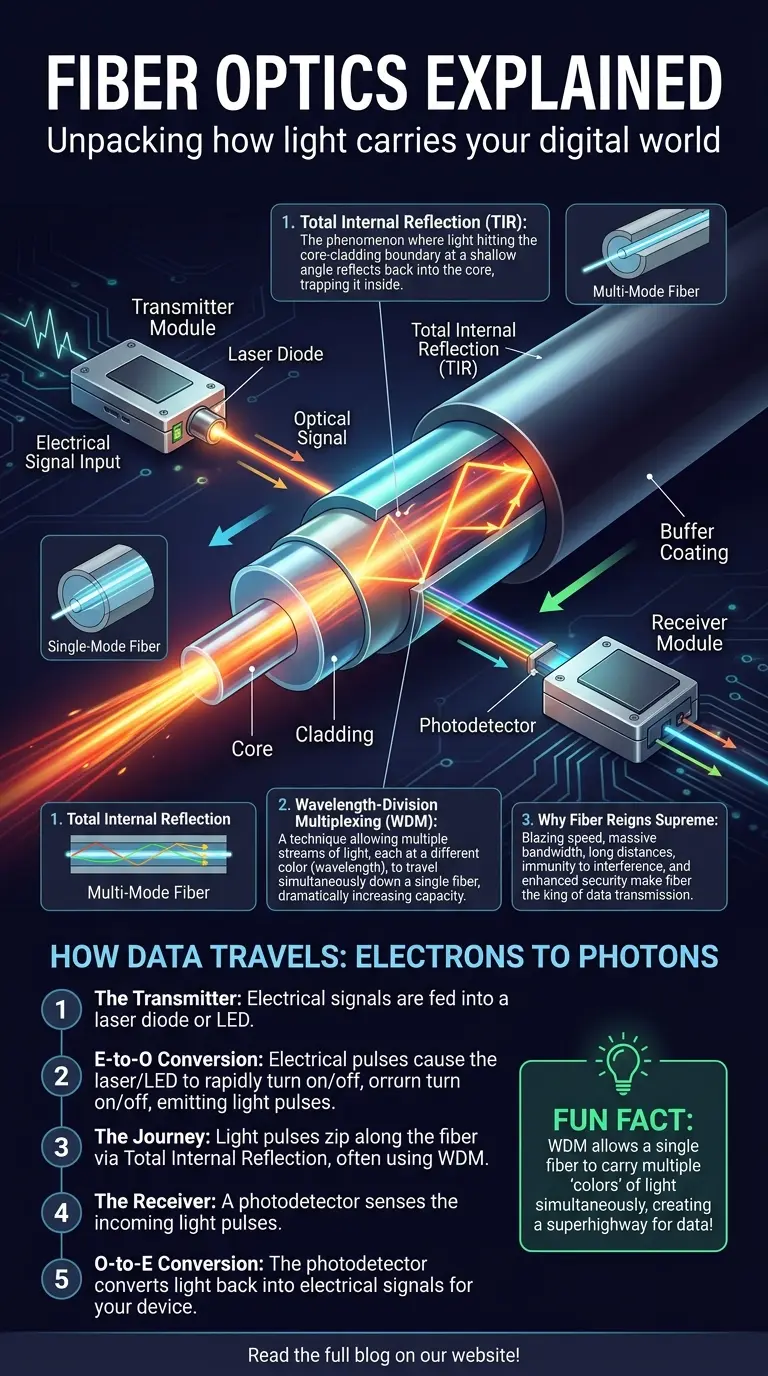
Detailed infographic illustrating fiber optics technology, featuring a cutaway view of a fiber optic cable with light traveling through its core, labeled components like core, cladding, buffer, transmitter, and receiver. Explanations include total internal reflection, how data is converted from electrical to optical signals, and the benefits of fiber optic internet. Designed for educational tech enthusiasts and SEO optimized for image search.

Unraveling the Mystery: How Light Powers Your Internet! 💡

92
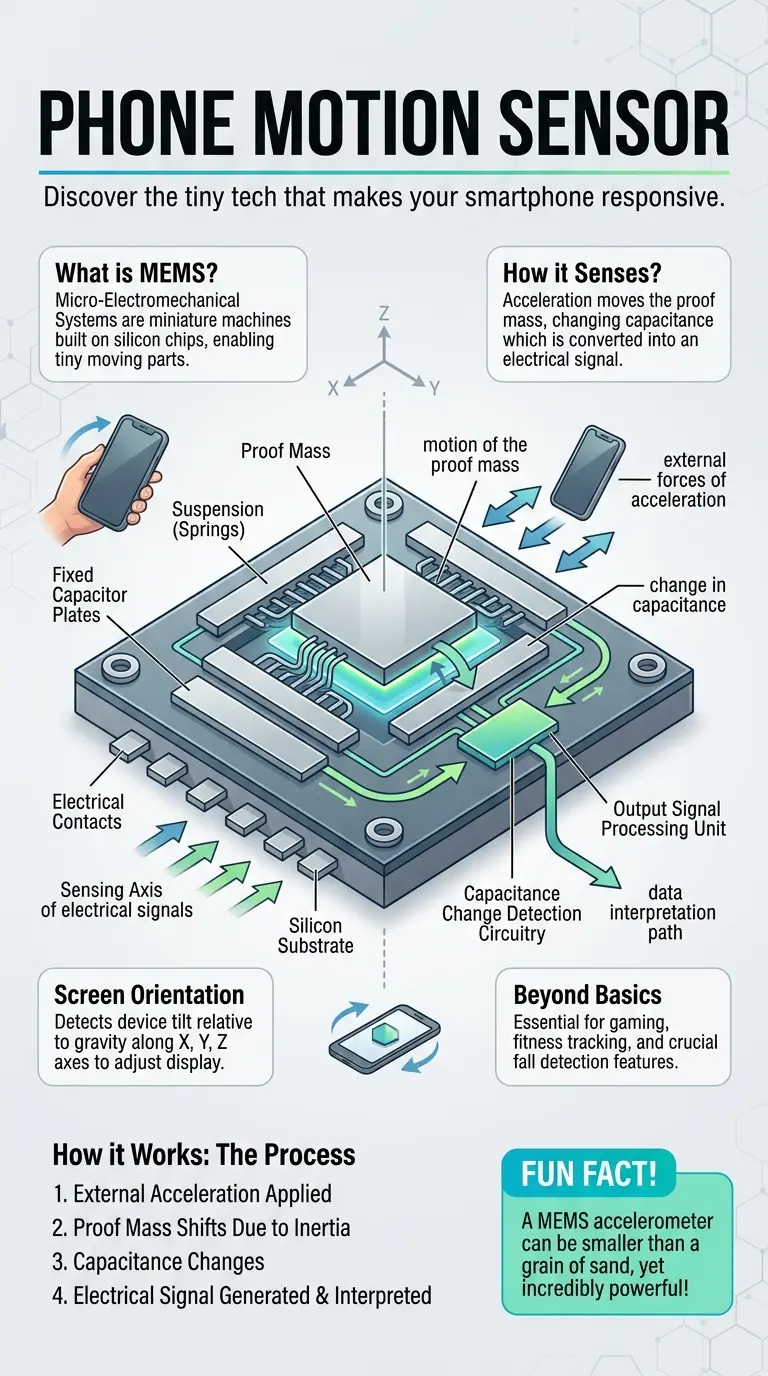
Infographic detailing how smartphone accelerometers work, featuring a cutaway diagram of a MEMS sensor, labeled components like proof mass and capacitor plates, arrows illustrating motion and signal flow, and explanation boxes for screen rotation, fall detection, and gaming applications. Educational tech illustration in a clean, modern style.

Ever Wonder How Your Phone Senses Motion? Discover the Accelerometer! 📱

99
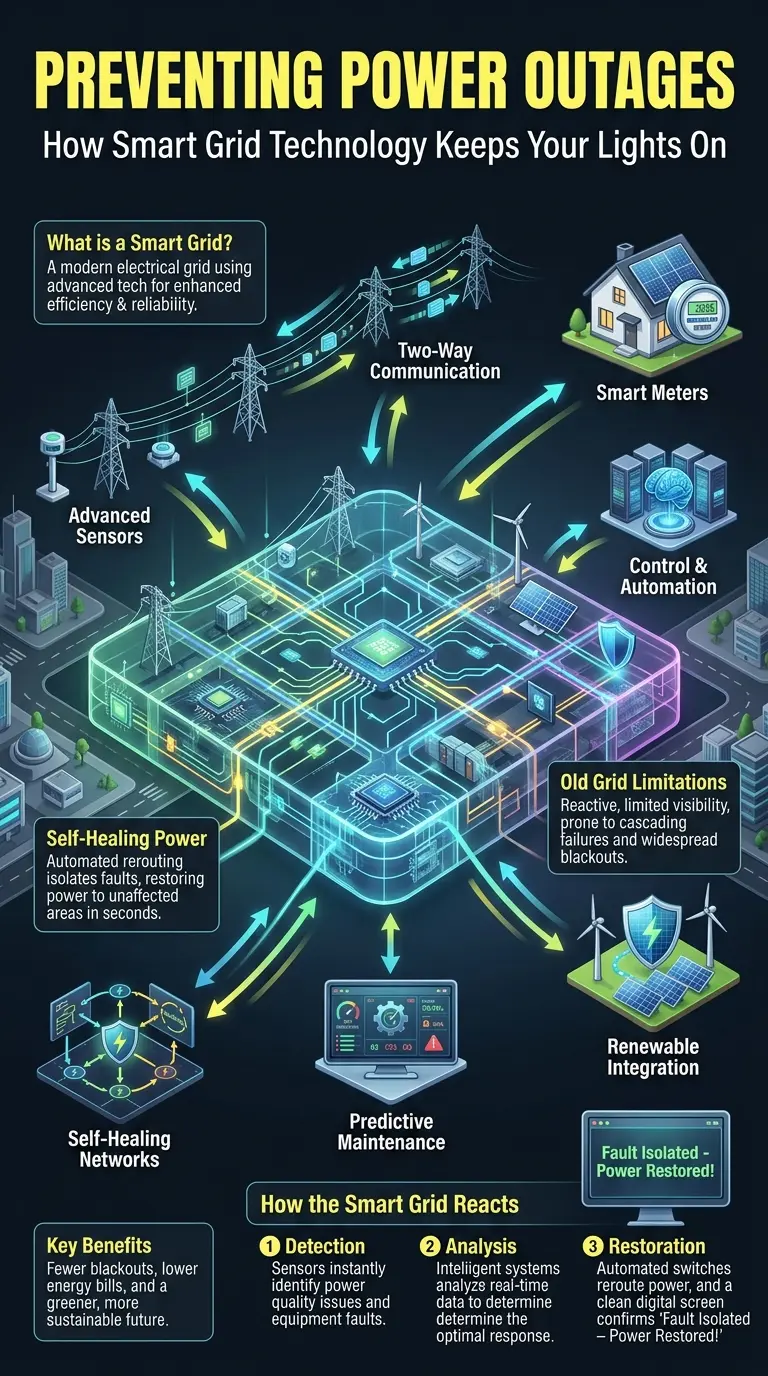
Educational infographic detailing the Smart Grid's role in preventing power outages. Visual explanation of advanced sensors, two-way communication, smart meters, and automation within a modern electrical network. Shows how smart grid technology improves reliability, efficiency, and integrates renewable energy, presented in a dark, tech-magazine style. Keywords: smart grid, power outages, energy, electricity, technology, blackout prevention, renewable energy, smart meters, automation, utility.

Unlock the Power: How Smart Grids Prevent Outages 💡

98
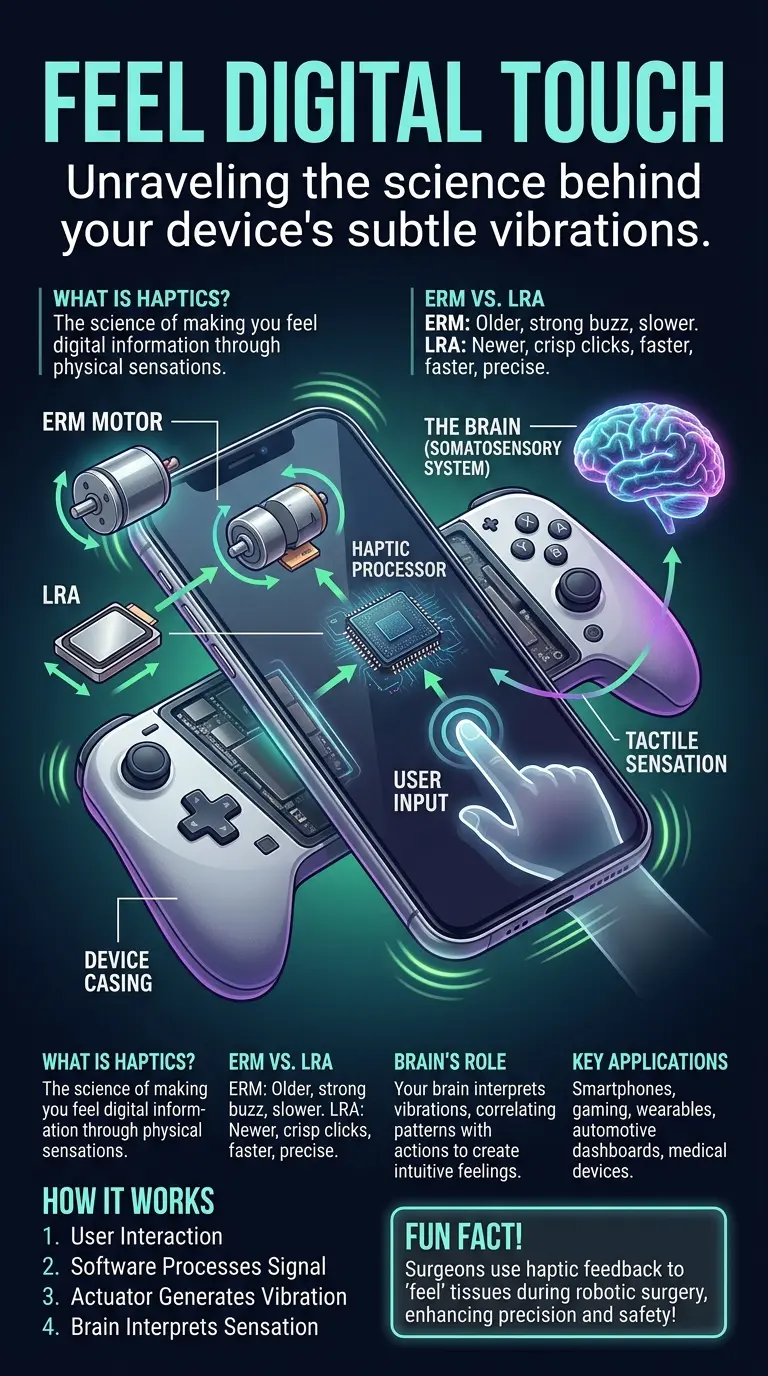
Educational infographic detailing haptic feedback technology. Features a central cutaway illustration of a modern smartphone or game controller, exposing internal components like Eccentric Rotating Mass (ERM) motors and Linear Resonant Actuators (LRAs). Labeled elements include user input, haptic processor, somatosensory system (brain), and tactile sensation, connected by directional arrows showing signal and vibration flow. The infographic includes explanation boxes for "What is Haptics?", "ERM vs. LRA", "Brain's Role", and "Key Applications", a 4-step process section, and a "Fun Fact" box about haptics in surgery. The visual style is semi-realistic, tech magazine-like, with a dark background and vibrant, modern color palette, optimized for vertical viewing.

How Haptic Feedback Tricks Your Brain into Feeling Digital Realities 🧠

95
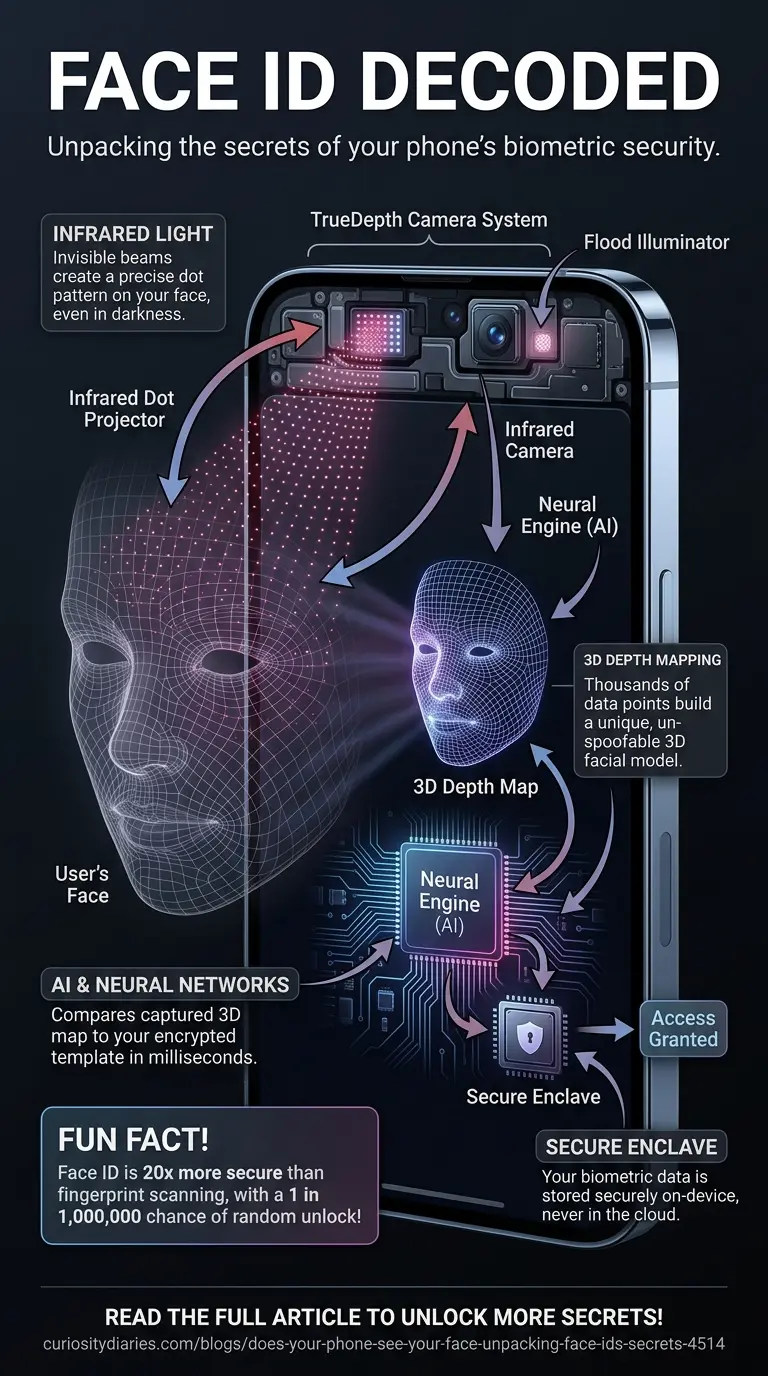
Detailed infographic illustrating the inner workings of smartphone facial recognition technology, specifically Face ID. Features a cutaway view of a phone's TrueDepth camera system, showing infrared dot projectors, infrared camera, neural engine, and secure enclave. Explains 3D depth mapping, AI processing, and secure biometric data storage using arrows, labeled components, explanation boxes, and a fun fact about security.

Unmasking Face ID: How Your Phone Really Sees You 🔒

89
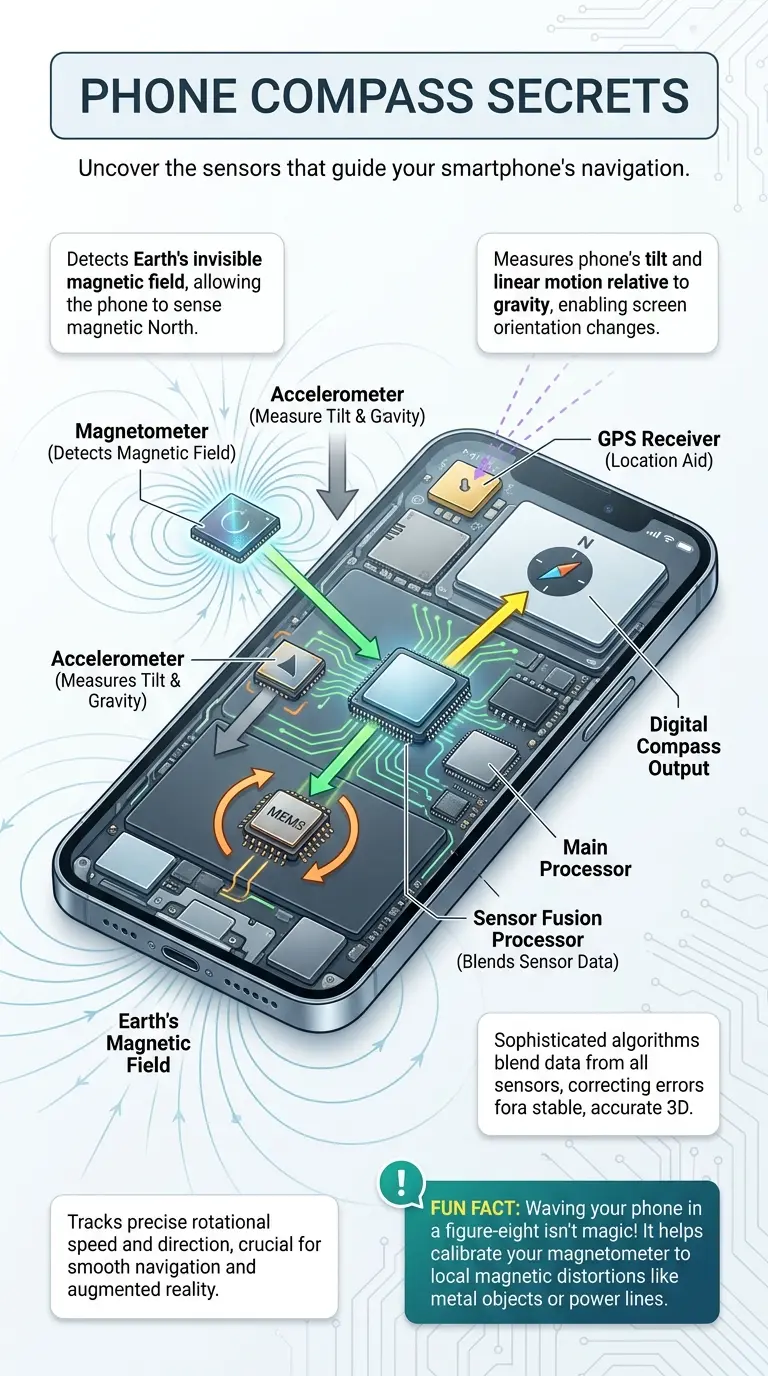
Educational infographic detailing how a smartphone's internal sensors – magnetometer, accelerometer, and gyroscope – combine data through sensor fusion to accurately determine which way is North. Includes explanations of key components, their functions, and a fun fact about calibration.

How Your Phone Knows North: The Hidden Tech 🧭

96
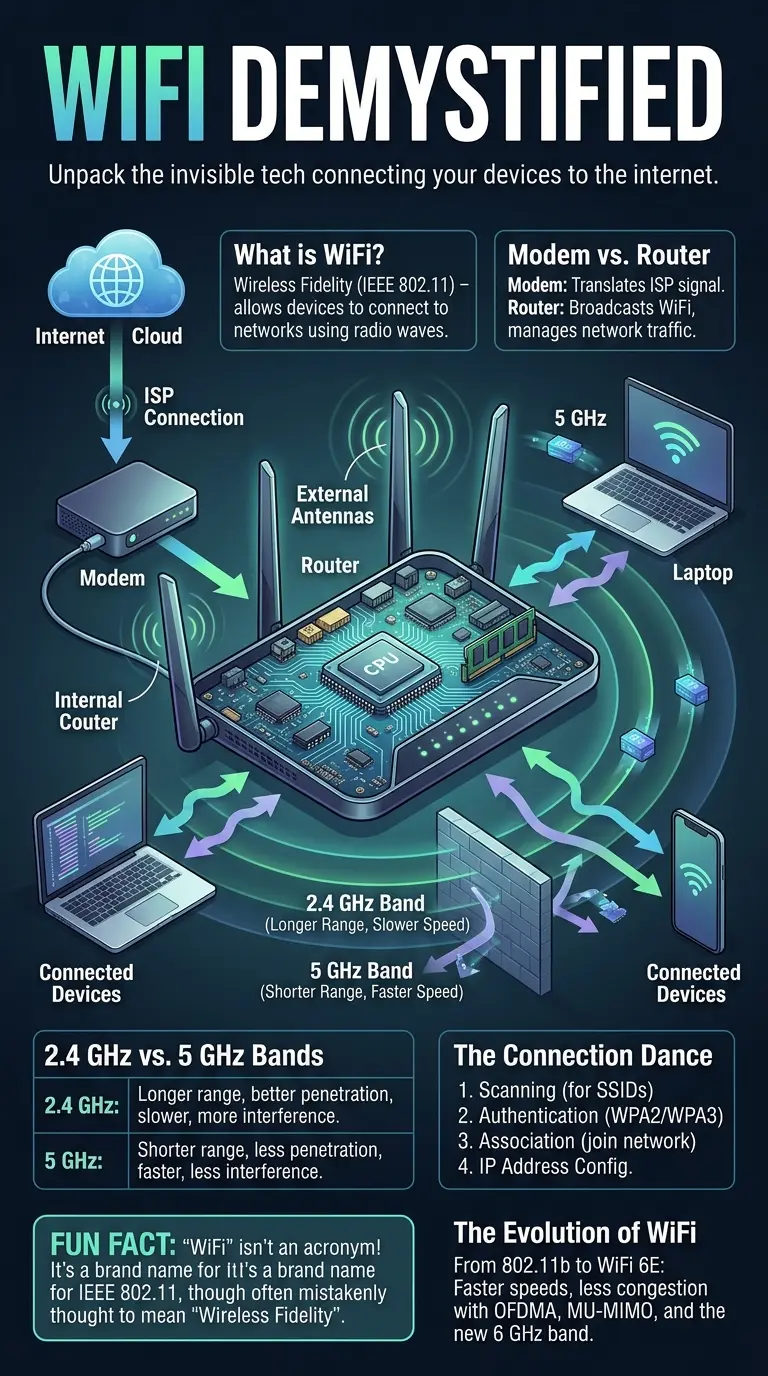
Detailed infographic explaining how WiFi works, including components like modems, routers, 2.4 GHz and 5 GHz bands, data flow, and connection steps. Ideal for understanding wireless internet technology.

Unlock the Secrets of Your WiFi Signal! 📶

84
Infographic detailing the internal workings of a smartphone camera, showing light entering the multi-element lens, hitting the CMOS image sensor with a Bayer filter, being processed by the Image Signal Processor (ISP), and illustrating computational photography features like HDR, Night Mode, and Portrait Mode. Explains the complex process of digital vision from light capture to final image output, optimized for search engines and image galleries.

Unlocking Your Phone Camera's Hidden Powers 📸

86

Educational infographic illustrating how data instantly crosses continents. Features a semi-realistic cutaway view of the Earth showing glowing data pathways, undersea fiber optic cables, local routers, ISP networks, and destination servers. Labeled components explain the data journey, including data packets, IP addresses, and DNS. Directional arrows indicate data flow. Includes explanation boxes for key concepts, a numbered step-by-step process, and a highlighted fun fact about internet infrastructure. Designed in an educational tech magazine style with a modern color palette for high visual clarity.

The Invisible Superhighway: How Your Data Travels Globally 🚀

97
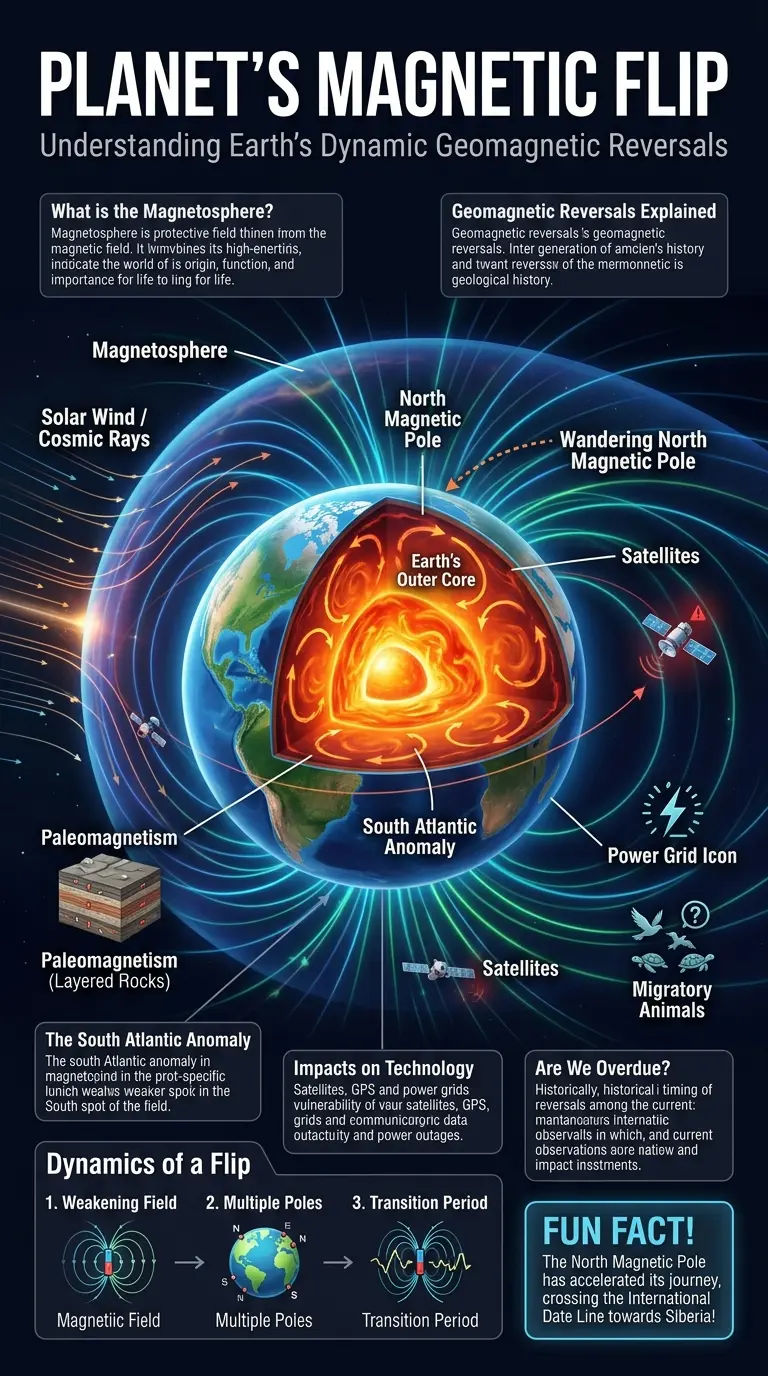
Educational infographic detailing Earth's magnetic field, its magnetosphere, and the process of geomagnetic reversals. Features a cutaway illustration of Earth's core generating the magnetic field, showing pole migration, solar wind deflection, and potential impacts on satellites, power grids, and migratory animals. Includes labeled components, directional arrows, explanation boxes, a step-by-step reversal process, and a fun fact. Designed for social media, 9:16 aspect ratio, high detail for image gallery indexing.

Is Earth's Magnetic Field Flipping? Uncover the Science! 🌍

81
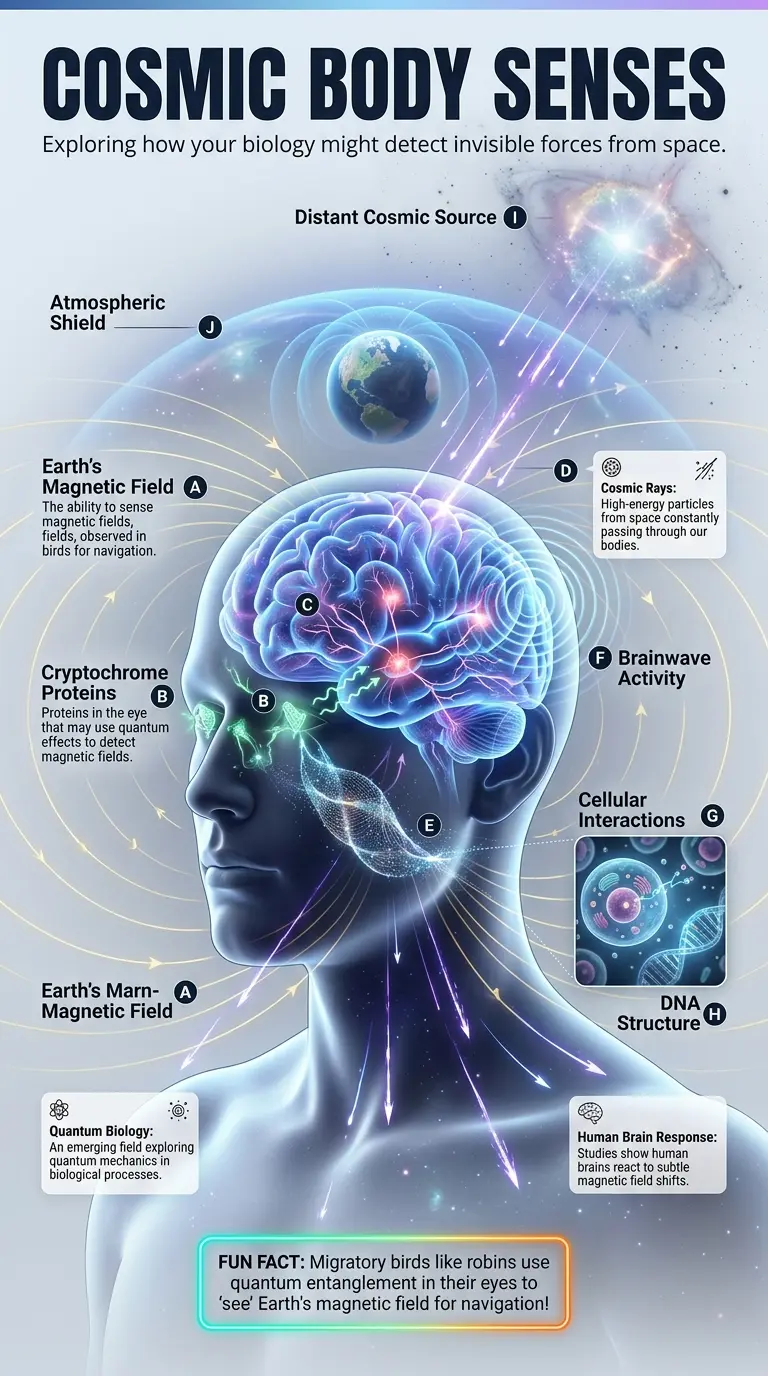
Infographic detailing how human bodies might sense unseen cosmic signals like magnetic fields and cosmic rays through quantum biology. Features a stylized human head, cryptochrome proteins, brainwave activity, and labeled explanations of magnetoreception and quantum biology. Designed for SEO and image galleries.

Are You a Cosmic Antenna? Uncover Your Hidden Senses! ✨

97
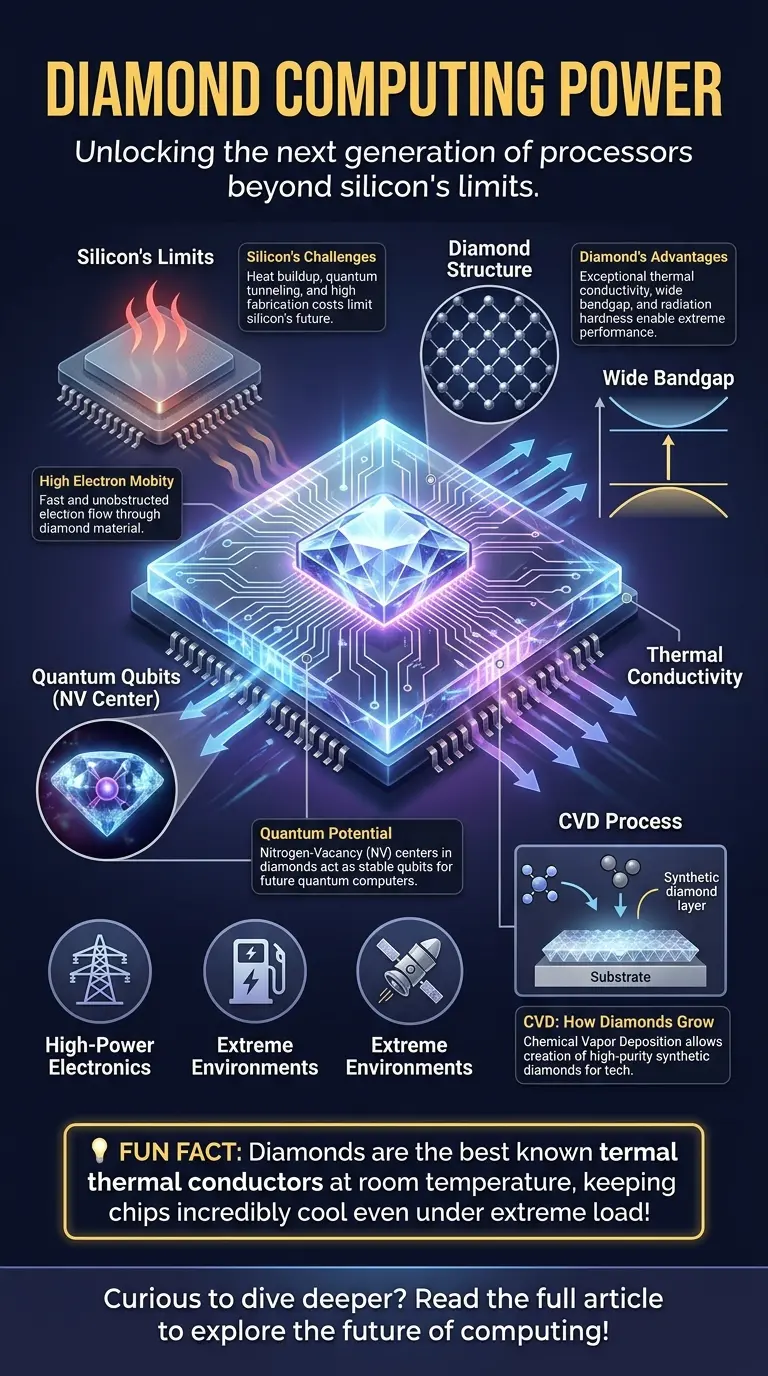
Educational infographic detailing diamond chips, comparing them to silicon, explaining properties like thermal conductivity and wide bandgap, showing quantum potential with NV centers, the CVD process, and applications in high-power and extreme environment computing.

Diamond Chips: Unlocking Computing's Next Era 💎

66
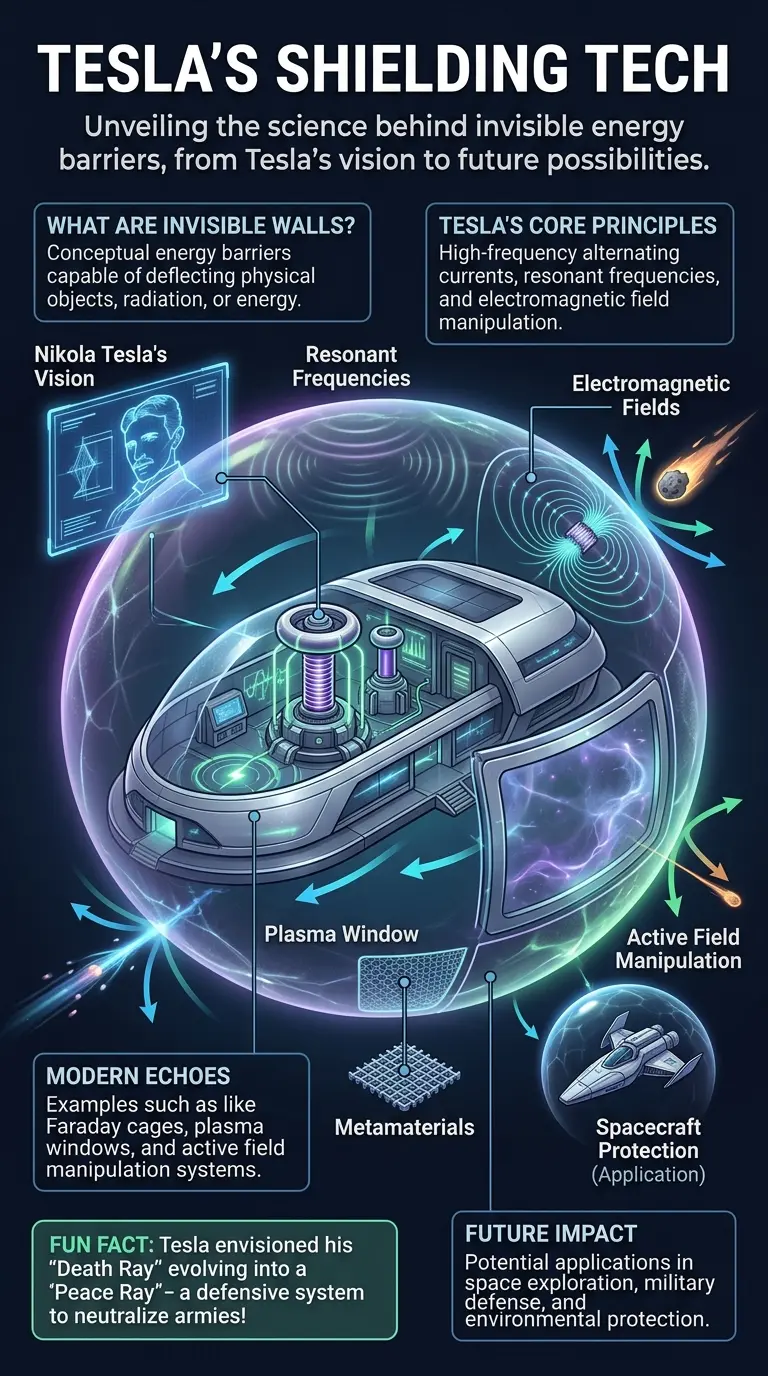
Educational infographic detailing Nikola Tesla's visionary concepts of invisible energy shields and their modern scientific echoes. Features a futuristic city protected by a shimmering force field, labeled components like plasma windows, electromagnetic shielding, and active field manipulation, with arrows showing energy flow and threat deflection. Designed for SEO, image galleries, and Pinterest.

Unlocking Tesla's Invisible Shields: A Glimpse into Tomorrow 🛡️

76
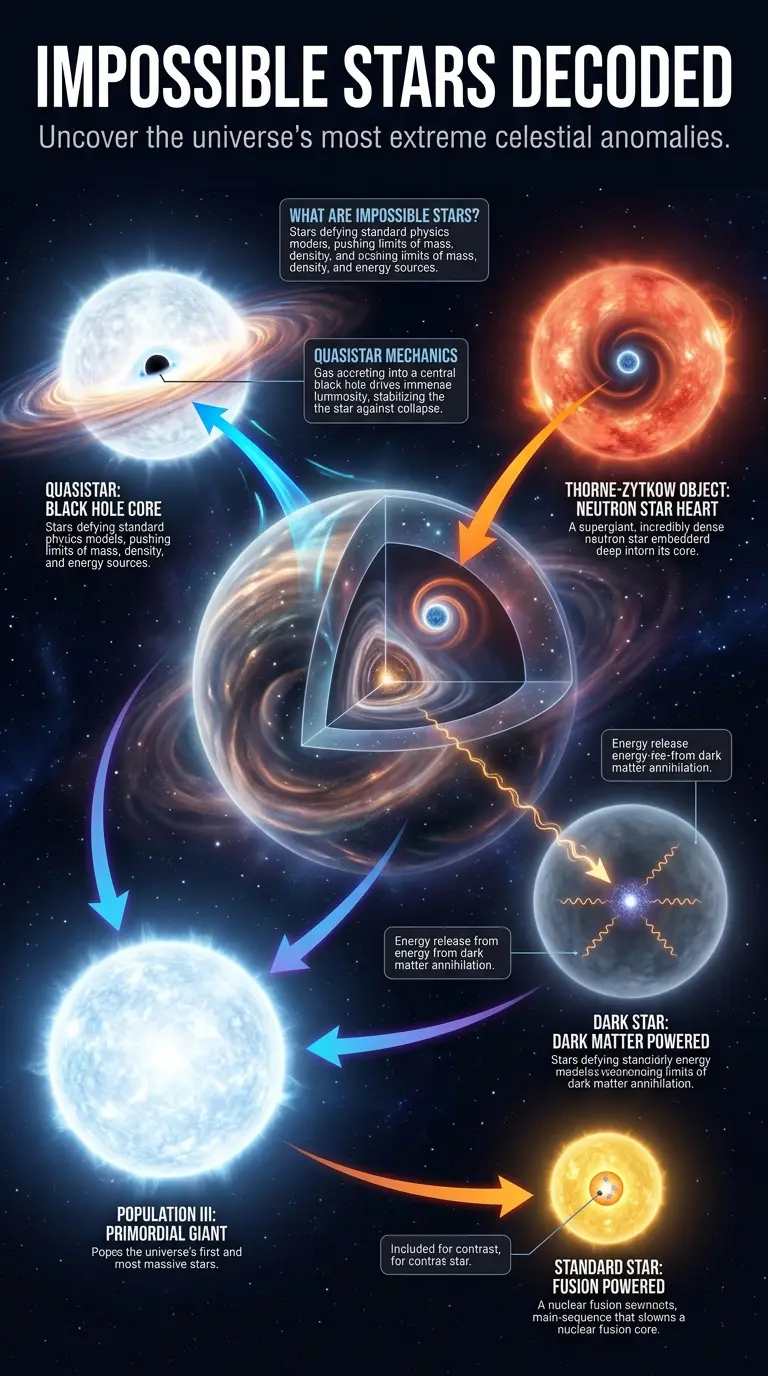
Educational infographic detailing 'impossible stars' such as Quasistars, Thorne-Zytkow Objects, Dark Stars, and Population III stars. The visual features a central cosmic anomaly with labeled cutaway sections for each star type, explaining their unique structures, energy sources, and how they challenge conventional astrophysics, set against a deep space background for a Pinterest-style educational post.

Are 'Impossible' Stars Real? Uncover Cosmic Anomalies That Defy Physics! ✨

62
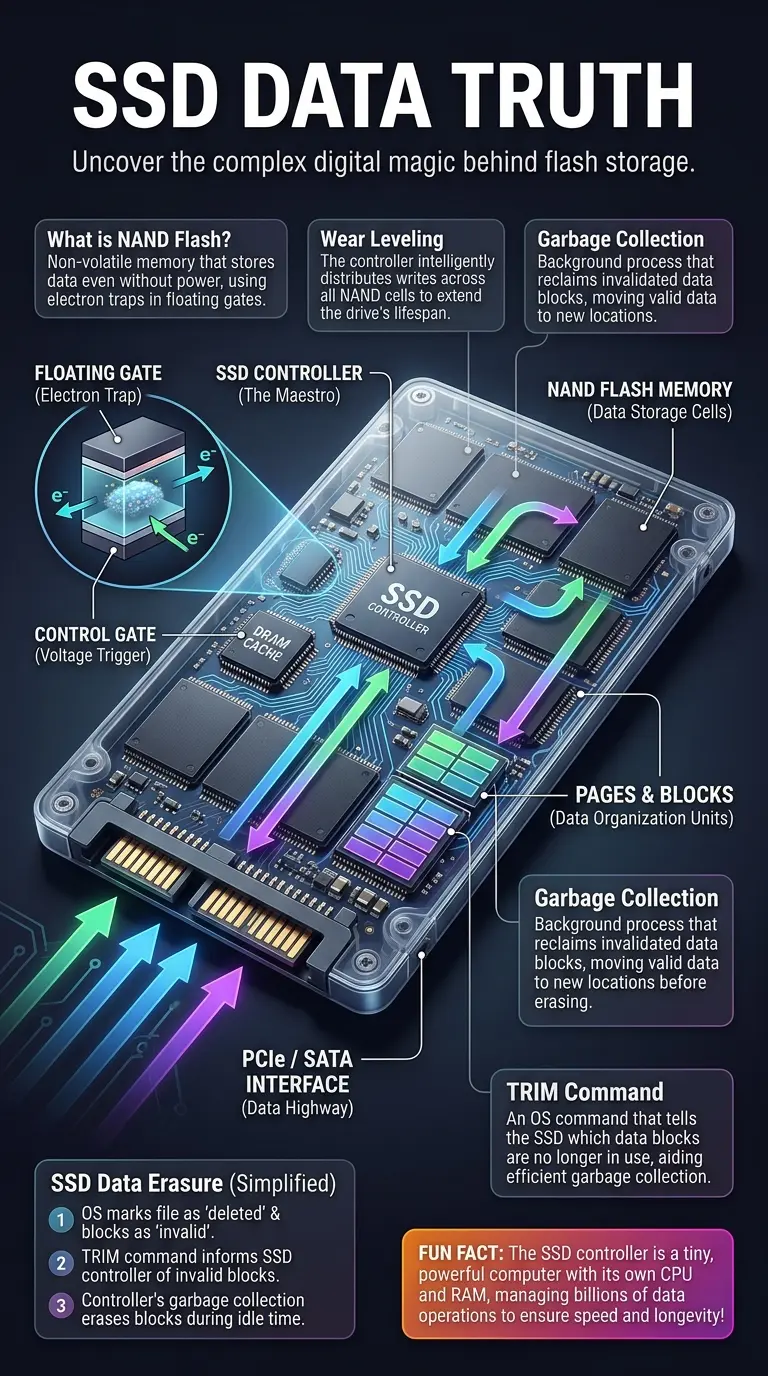
Educational infographic detailing how SSDs work, including NAND flash memory, SSD controller functions like wear leveling and garbage collection, and the process of data erasure. Features a cutaway view of an SSD with labeled components and data flow arrows.

Unraveling the SSD: The Truth About Flash Storage & Data Erasure! 💡

67
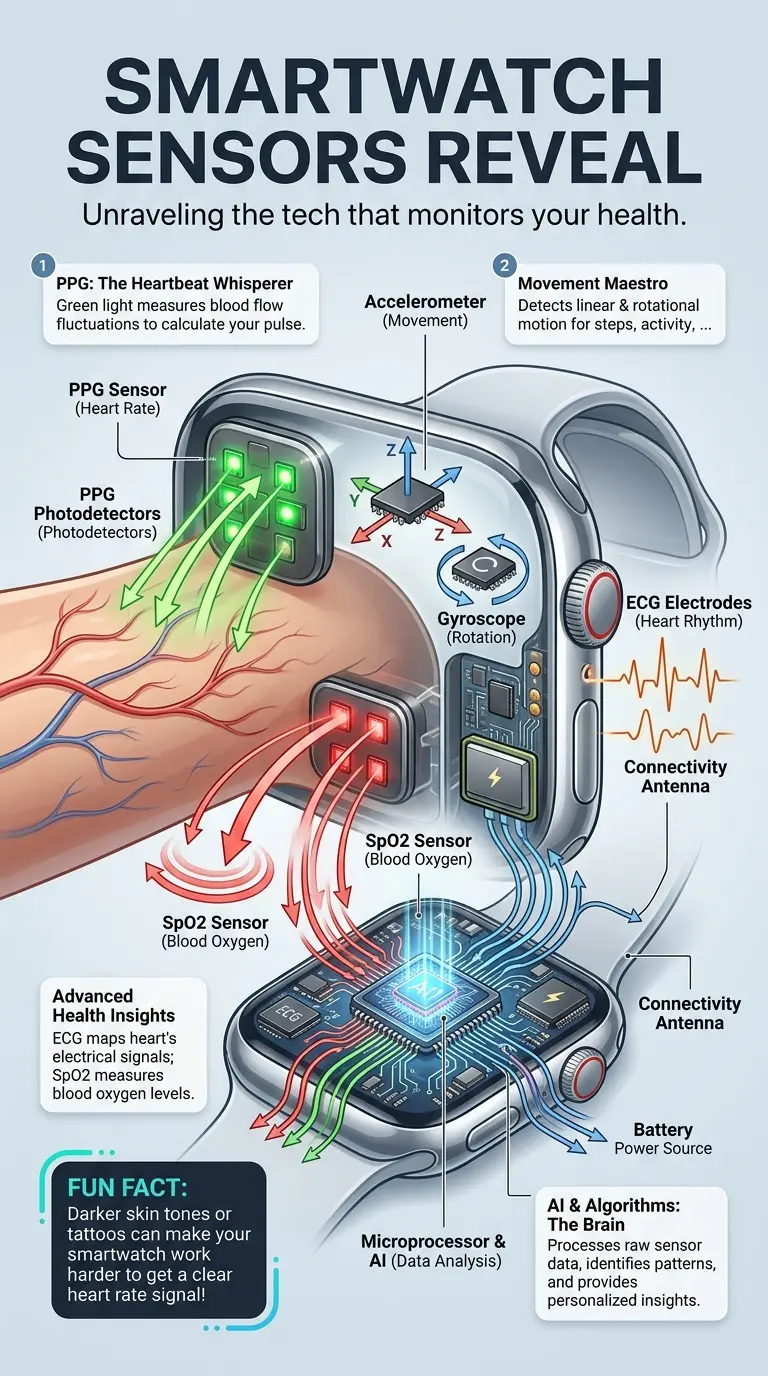
Infographic detailing the internal sensors and technology of a smartwatch, including Photoplethysmography (PPG), Accelerometer, Gyroscope, Electrocardiogram (ECG), SpO2 (Blood Oxygen Saturation), and Artificial Intelligence (AI), explaining how they monitor health data like heart rate, movement, sleep, and blood oxygen. Designed for understanding modern wearable tech and its health insights.

Unlock Your Health: How Smartwatches Really See You! ⌚

69
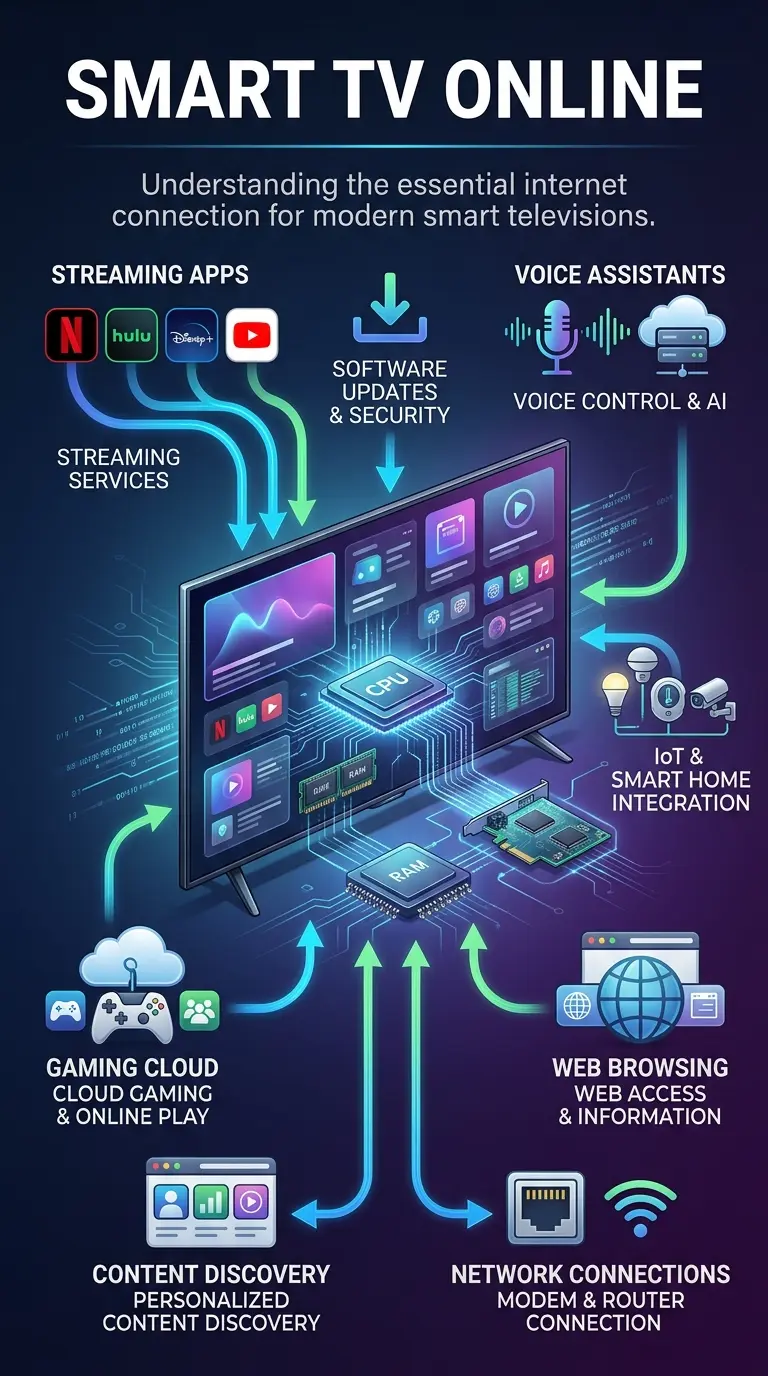
Infographic explaining why smart TVs require an internet connection, detailing features like streaming, app ecosystems, software updates, voice control, smart home integration, and data flow. Features a modern smart TV with internal components and data pathways on a dark background.

Why Your Smart TV Needs the Internet (It's More Than Just Streaming!) 💡

66
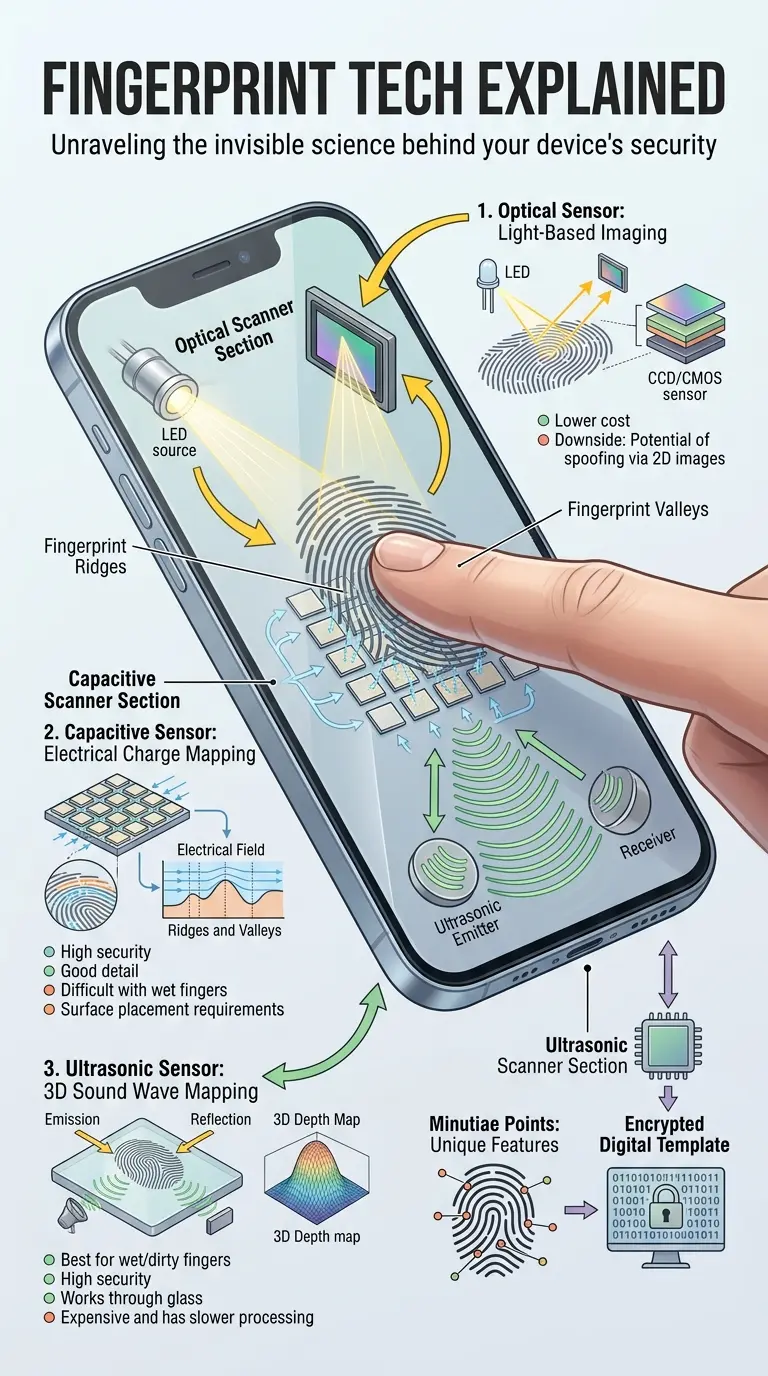
Educational infographic detailing the three main types of fingerprint scanning technology: Optical, Capacitive, and Ultrasonic. It visually explains how each scanner type detects unique fingerprint patterns using light, electrical capacitance, or sound waves. The infographic includes labeled components, directional arrows illustrating data flow for enrollment and verification processes, and small explanation boxes for key concepts. Visuals feature a stylized human finger interacting with a smartphone screen, revealing the underlying technology.

Beyond the Touch: How Fingerprint Scanners *Really* Work! 🕵️‍♀️

55

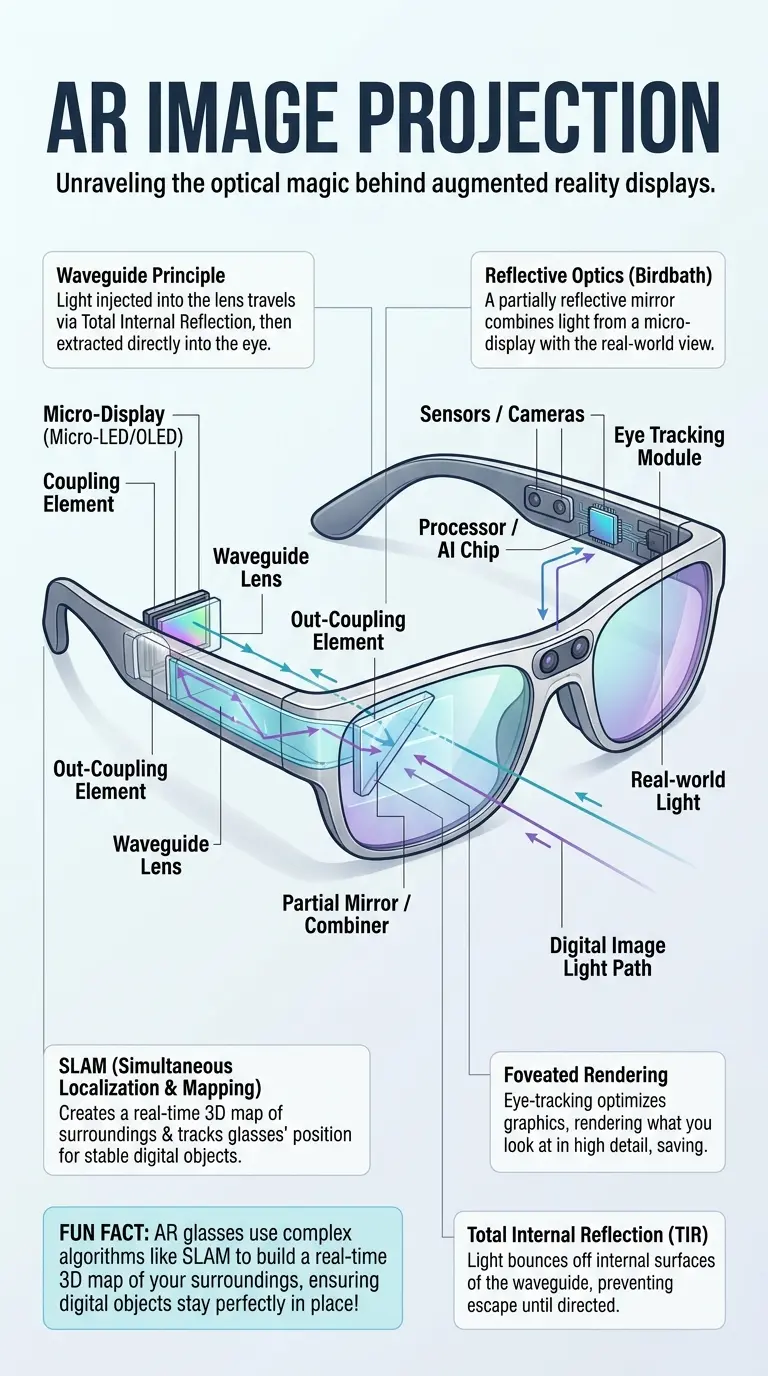
Educational infographic detailing the internal workings of augmented reality (AR) glasses, showing how digital images are projected onto the real world using waveguide and reflective optics. Features a cutaway view of AR glasses with labeled components like micro-displays, coupling elements, waveguide lenses, sensors, and processors. Includes directional arrows for light and data flow, and explanation boxes for key concepts such as SLAM, Foveated Rendering, and Total Internal Reflection. Designed in a vertical 9:16 aspect ratio with a clean, tech magazine style and a modern color palette.

Unmasking AR: How Digital Images Blend with Your Reality! 👓

59
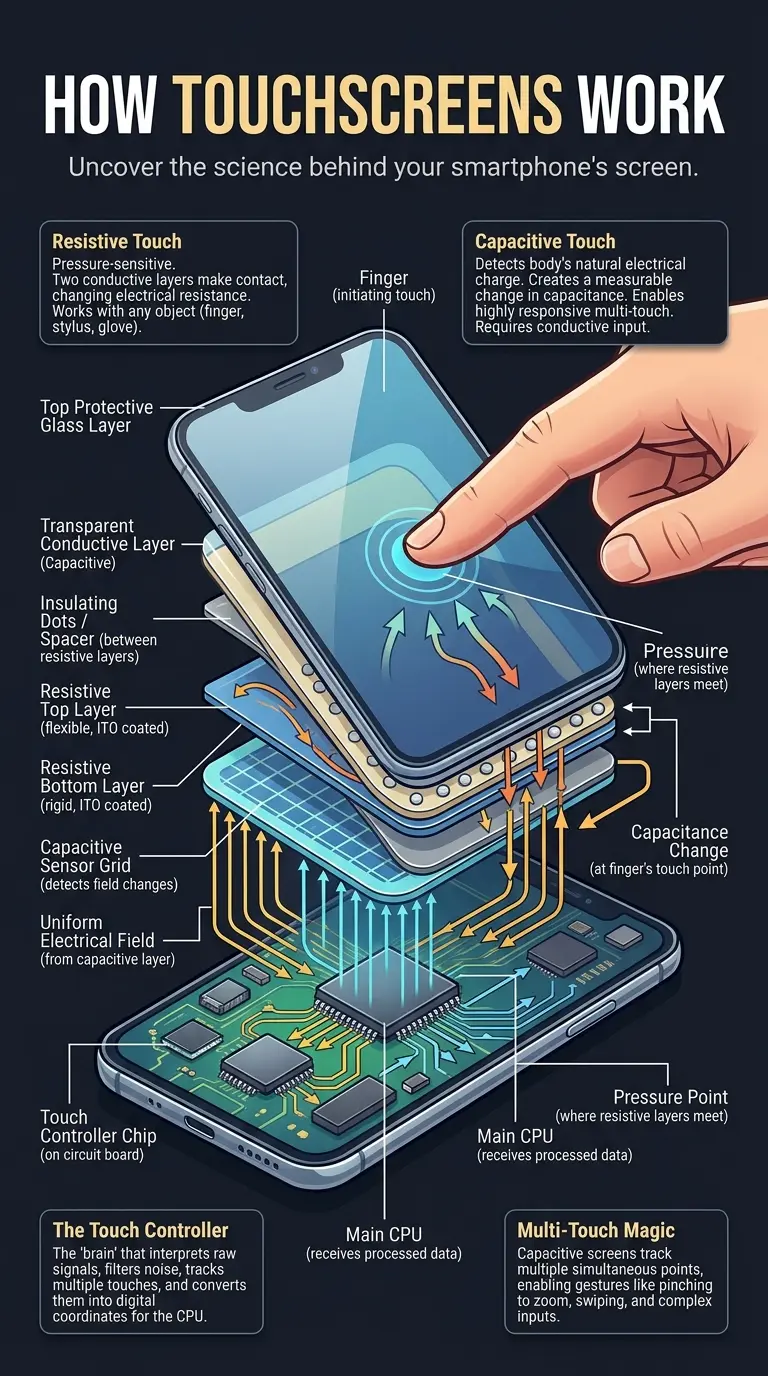
Educational infographic explaining how touchscreens sense your finger, detailing the mechanisms of resistive and capacitive touch technology with a cutaway view of a smartphone screen, labeled components, explanation boxes, process flow, and a fun fact.

Unlock Your Phone's Secret: How Touchscreens *Really* Work! 👆

59

Educational infographic detailing the internal workings of a smart speaker and how voice AI processes human speech. Features a cutaway illustration of a smart speaker, labeled components like microphone arrays, beamforming, wake word detection, speech-to-text, and natural language processing, with arrows illustrating data flow. Explains how smart speakers hear, understand, and respond to voice commands, optimized for vertical social media platforms like Pinterest.

Unlock the Secrets: How Your Smart Speaker Truly Hears You 👂

52